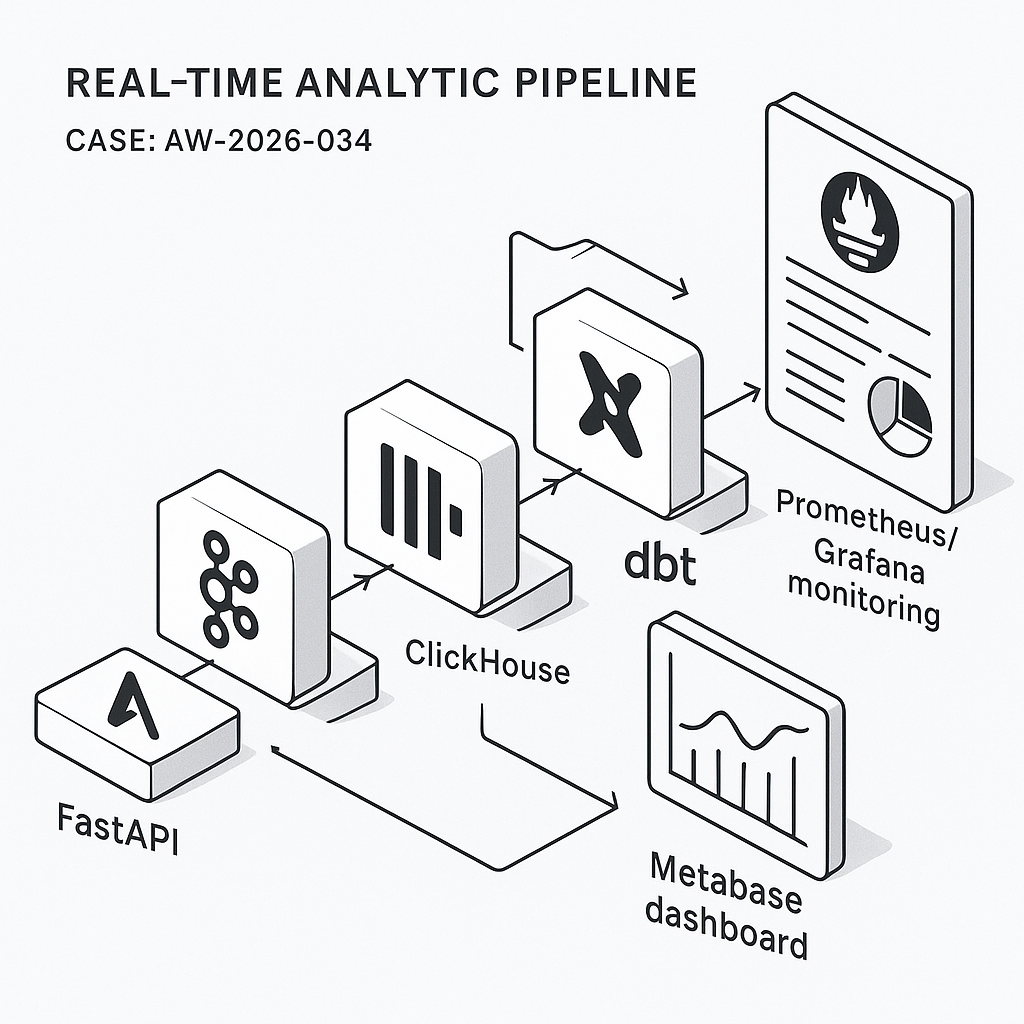
This post walks through a practical, low-ops real-time analytics pipeline for SaaS product metrics. It’s built for high write throughput, sub-second query speed, and simple ops:
– Ingest: FastAPI event endpoint
– Stream: Redpanda (Kafka-compatible)
– Storage/OLAP: ClickHouse
– Transform: dbt (on ClickHouse)
– Dashboards/alerts: Metabase
– Observability: OpenTelemetry + Prometheus + Grafana (pipeline health)
Target outcomes: DAU/WAU/MAU, activation funnels, retention cohorts, feature adoption, latency/error rates, and per-tenant views.
1) Event schema and contracts
Define a minimal, versioned schema so producers and consumers stay stable.
– Topic: product_events (partition by user_id or tenant_id)
– JSON payload:
{
“event”: “button_clicked”,
“user_id”: “u_123”,
“tenant_id”: “t_9”,
“session_id”: “s_abc”,
“ts”: “2026-03-14T18:25:43.511Z”,
“properties”: {“button_id”: “save”, “plan”: “pro”, “screen”: “editor”},
“context”: {“app_version”: “2.4.1”, “os”: “macOS”, “locale”: “en-US”},
“event_version”: 1
}
Rules:
– ISO-8601 UTC timestamps
– event_version increments on breaking changes
– Limit properties/context to primitive types
– Drop PII or hash it client-side
2) Ingestion API (FastAPI)
Expose a POST /events that validates payloads and writes to Redpanda.
– Use pydantic for validation
– Rate-limit per IP/tenant
– Buffer and batch send to Redpanda using librdkafka
Python snippet (core idea):
from fastapi import FastAPI, Request, HTTPException
from pydantic import BaseModel, Field
from confluent_kafka import Producer
import json, time
p = Producer({“bootstrap.servers”: “redpanda:9092”, “queue.buffering.max.messages”: 100000})
class Event(BaseModel):
event: str
user_id: str
tenant_id: str
session_id: str
ts: str
properties: dict = Field(default_factory=dict)
context: dict = Field(default_factory=dict)
event_version: int = 1
app = FastAPI()
@app.post(“/events”)
async def ingest(ev: Event):
try:
p.produce(“product_events”, json.dumps(ev.dict()).encode(“utf-8”), key=ev.tenant_id)
p.poll(0)
return {“ok”: True}
except Exception:
raise HTTPException(status_code=503, detail=”Backpressure”)
3) Streaming into ClickHouse
ClickHouse consumes directly from Kafka-compatible topics via the Kafka engine and writes to a MergeTree table via a materialized view.
– Kafka table:
CREATE TABLE kafka_product_events (
event String,
user_id String,
tenant_id String,
session_id String,
ts DateTime64(3, ‘UTC’),
properties JSON,
context JSON,
event_version UInt8
) ENGINE = Kafka
SETTINGS kafka_broker_list = ‘redpanda:9092’,
kafka_topic_list = ‘product_events’,
kafka_group_name = ‘ch_consumer_v1’,
kafka_format = ‘JSONEachRow’,
kafka_num_consumers = 3;
– Target table:
CREATE TABLE product_events (
event LowCardinality(String),
user_id String,
tenant_id String,
session_id String,
ts DateTime64(3, ‘UTC’),
properties JSON,
context JSON,
event_version UInt8
)
ENGINE = MergeTree
PARTITION BY toYYYYMM(ts)
ORDER BY (tenant_id, ts, event, user_id)
TTL ts + INTERVAL 365 DAY DELETE
SETTINGS index_granularity = 8192;
– Materialized view:
CREATE MATERIALIZED VIEW mv_kafka_to_events
TO product_events AS
SELECT
event, user_id, tenant_id, session_id,
parseDateTime64BestEffortOrNull(ts) AS ts,
properties, context, event_version
FROM kafka_product_events;
Notes:
– Use LowCardinality for string dims
– Partition by month for prune speed and cost
– TTL for retention
4) Aggregations for speed and cost
Pre-aggregate common metrics into rollup tables updated continuously.
– Daily user activity:
CREATE MATERIALIZED VIEW mv_events_to_daily
TO daily_user_activity AS
SELECT
tenant_id,
toDate(ts) AS d,
event,
uniqExact(user_id) AS uu
FROM product_events
GROUP BY tenant_id, d, event;
CREATE TABLE daily_user_activity (
tenant_id String,
d Date,
event LowCardinality(String),
uu UInt64
) ENGINE = ReplacingMergeTree()
ORDER BY (tenant_id, d, event);
– Sessionized funnels (optional): build session_start/session_end materialized views using window functions or handle in dbt.
5) Transformations with dbt (ClickHouse)
Use dbt-clickhouse for semantic models, derived metrics, and SCD dimensions.
– Models:
– stg_product_events: cast types, filter bad rows, standardize event names
– fct_event_counts_daily: DAU/WAU/MAU per tenant
– fct_funnels: configurable funnel steps by event and time window
– fct_retention: N-day retention by cohort_start = first_seen_date
Example dbt SQL idea:
select
tenant_id,
toDate(ts) as d,
countIf(event = ‘signup’) as signups,
uniqExactIf(user_id, event = ‘login’) as dau
from {{ ref(‘stg_product_events’) }}
group by tenant_id, d
6) Dashboards in Metabase
Connect Metabase directly to ClickHouse.
– Collections:
– Product KPIs: DAU/WAU/MAU, activation rate, feature adoption
– Growth: signups, conversion by channel (if captured)
– Reliability: event ingestion lag, API error rates
– Segmentation:
– Filters: tenant_id, plan, app_version, region
– Drill-through: user-level trails (guard with RBAC)
– Alerts:
– Pulses to Slack/Email when DAU drops > X% day-over-day
– Alert if ingestion lag > N minutes (query kafka table offsets vs. latest ts)
7) Health monitoring and SLIs
Track pipeline reliability separately from business metrics.
– Ingestion SLIs:
– HTTP 2xx rate and p95 latency for POST /events (Prometheus + FastAPI metrics)
– Backpressure count (producer queue size)
– Stream SLIs:
– Kafka consumer lag per partition (Redpanda metrics)
– Storage SLIs:
– ClickHouse insert errors, merges backlog, disk usage, parts count
– Dashboards:
– Grafana board combining FastAPI, Redpanda, ClickHouse exporters
– Alerts:
– Pager on consumer lag > threshold
– Disk usage > 80%
– Insert failures > 0.1% 5-min rate
8) Security and governance
– API: JWT per tenant, HMAC request signing, rate limits
– Data: avoid PII or hash client-side; encrypt at rest and in transit
– ClickHouse RBAC: read-only roles for BI, tenant row-level security using allow_read_policies
– Retention: enforce TTL; archive cold data to S3 via S3 table engine if needed
9) Deployment blueprint (Docker Compose)
Services:
– fastapi, redpanda, clickhouse, metabase, grafana, prometheus
– Optional: dbt runner (scheduled via cron/k8s Job)
Compose tips:
– Pin versions; mount persistent volumes for Redpanda/ClickHouse
– Separate networks for public API vs. internal data plane
– Set ClickHouse max_memory_usage, max_concurrent_queries
– Metabase env for ClickHouse driver; increase MB_JETTY_MAXTHREADS for load
10) Cost and performance notes
– Redpanda + ClickHouse can run on a single VM for MVP; scale to 3 nodes each later
– Expect 50k–200k events/sec on modest hardware with proper batching
– Keep event payloads < 2 KB; move large blobs to object storage
– Use materialized rollups for dashboards; avoid heavy ad-hoc scans during peak
11) Validation checklist
– Backfill: load historical CSV/Parquet to product_events via clickhouse-client
– Data quality: dbt tests for not_null, accepted_values, freshness
– Latency: end-to-end under 3s for most events
– Access: tenant-level filters enforced in Metabase
What you get
– Real-time dashboards that stay fast as volume grows
– Clear SLIs and actionable alerts
– A straightforward upgrade path from single node to HA
If you want a reference repo or a Compose file with sane defaults, reach out—we use this pattern in production for product analytics, ops telemetry, and feature adoption tracking.
This is an excellent overview of a modern analytics stack, and the emphasis on a versioned event schema is a crucial point. How do you approach enforcing those contracts on the producer side to maintain data quality downstream?
Good question—contract enforcement on the producer side is where most downstream pain is either prevented or guaranteed.
A few practical patterns I’ve seen work: keep schemas versioned in a registry (even a “lightweight” Git-backed registry can be enough), validate events at the FastAPI edge (reject/route-to-DLQ when required fields/types don’t match), and add CI checks that block deploys if a producer introduces a breaking change (e.g., schema compatibility tests + sample event fixtures). If you’re on Kafka/Redpanda with Avro/Protobuf, the usual compatibility rules help a lot; with JSON, JSON Schema validation plus strict linting/tests tends to be the next best thing.
What language/tooling are your producers using (Python/TS/Go, etc.)—and are your events JSON today or Avro/Protobuf?
Thanks for the excellent suggestions; our producers are mostly Python and TypeScript services sending JSON events, so your points on CI checks and schema validation are particularly relevant.