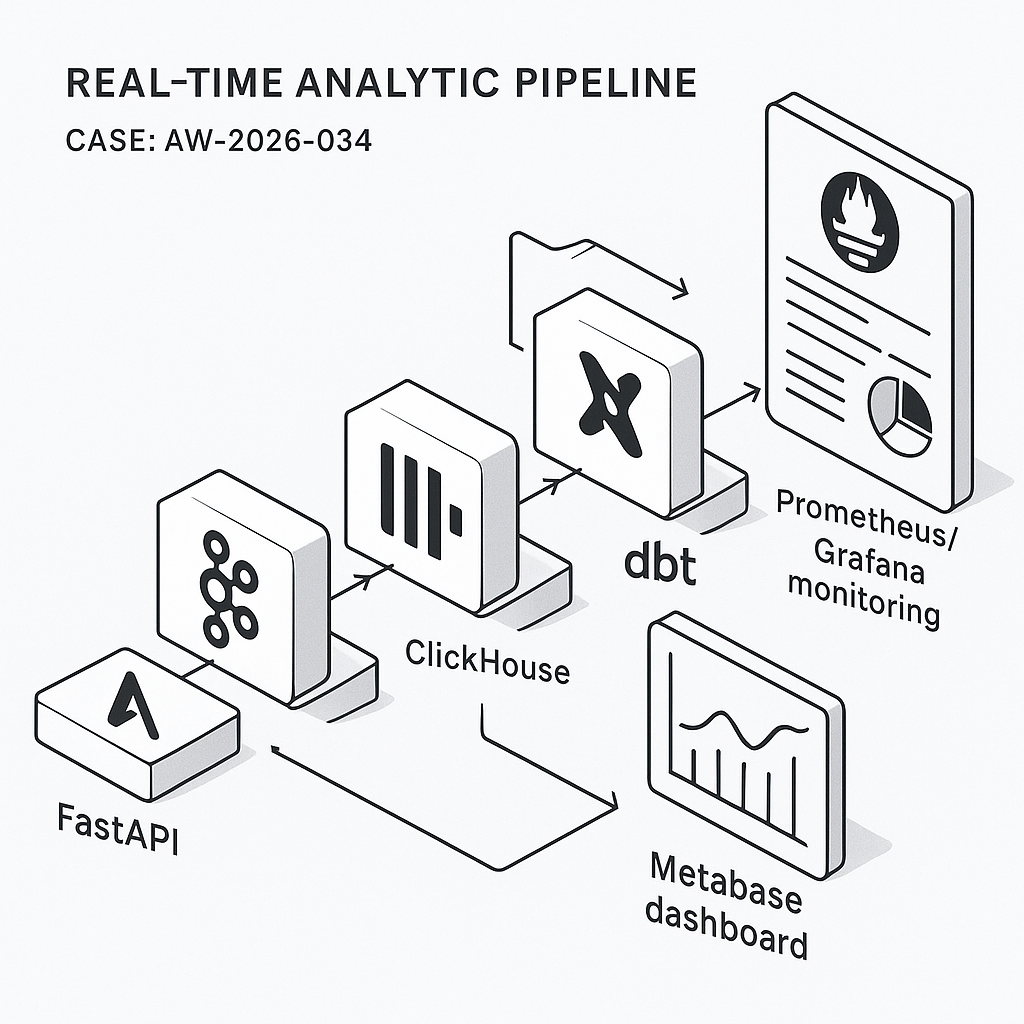
This post walks through a practical, low-ops real-time analytics pipeline for SaaS product metrics. It’s built for high write throughput, sub-second query speed, and simple ops:
– Ingest: FastAPI event endpoint
– Stream: Redpanda (Kafka-compatible)
– Storage/OLAP: ClickHouse
– Transform: dbt (on ClickHouse)
– Dashboards/alerts: Metabase
– Observability: OpenTelemetry + Prometheus + Grafana (pipeline health)
Target outcomes: DAU/WAU/MAU, activation funnels, retention cohorts, feature adoption, latency/error rates, and per-tenant views.
1) Event schema and contracts
Define a minimal, versioned schema so producers and consumers stay stable.
– Topic: product_events (partition by user_id or tenant_id)
– JSON payload:
{
“event”: “button_clicked”,
“user_id”: “u_123”,
“tenant_id”: “t_9”,
“session_id”: “s_abc”,
“ts”: “2026-03-14T18:25:43.511Z”,
“properties”: {“button_id”: “save”, “plan”: “pro”, “screen”: “editor”},
“context”: {“app_version”: “2.4.1”, “os”: “macOS”, “locale”: “en-US”},
“event_version”: 1
}
Rules:
– ISO-8601 UTC timestamps
– event_version increments on breaking changes
– Limit properties/context to primitive types
– Drop PII or hash it client-side
2) Ingestion API (FastAPI)
Expose a POST /events that validates payloads and writes to Redpanda.
– Use pydantic for validation
– Rate-limit per IP/tenant
– Buffer and batch send to Redpanda using librdkafka
Python snippet (core idea):
from fastapi import FastAPI, Request, HTTPException
from pydantic import BaseModel, Field
from confluent_kafka import Producer
import json, time
p = Producer({“bootstrap.servers”: “redpanda:9092”, “queue.buffering.max.messages”: 100000})
class Event(BaseModel):
event: str
user_id: str
tenant_id: str
session_id: str
ts: str
properties: dict = Field(default_factory=dict)
context: dict = Field(default_factory=dict)
event_version: int = 1
app = FastAPI()
@app.post(“/events”)
async def ingest(ev: Event):
try:
p.produce(“product_events”, json.dumps(ev.dict()).encode(“utf-8”), key=ev.tenant_id)
p.poll(0)
return {“ok”: True}
except Exception:
raise HTTPException(status_code=503, detail=”Backpressure”)
3) Streaming into ClickHouse
ClickHouse consumes directly from Kafka-compatible topics via the Kafka engine and writes to a MergeTree table via a materialized view.
– Kafka table:
CREATE TABLE kafka_product_events (
event String,
user_id String,
tenant_id String,
session_id String,
ts DateTime64(3, ‘UTC’),
properties JSON,
context JSON,
event_version UInt8
) ENGINE = Kafka
SETTINGS kafka_broker_list = ‘redpanda:9092’,
kafka_topic_list = ‘product_events’,
kafka_group_name = ‘ch_consumer_v1’,
kafka_format = ‘JSONEachRow’,
kafka_num_consumers = 3;
– Target table:
CREATE TABLE product_events (
event LowCardinality(String),
user_id String,
tenant_id String,
session_id String,
ts DateTime64(3, ‘UTC’),
properties JSON,
context JSON,
event_version UInt8
)
ENGINE = MergeTree
PARTITION BY toYYYYMM(ts)
ORDER BY (tenant_id, ts, event, user_id)
TTL ts + INTERVAL 365 DAY DELETE
SETTINGS index_granularity = 8192;
– Materialized view:
CREATE MATERIALIZED VIEW mv_kafka_to_events
TO product_events AS
SELECT
event, user_id, tenant_id, session_id,
parseDateTime64BestEffortOrNull(ts) AS ts,
properties, context, event_version
FROM kafka_product_events;
Notes:
– Use LowCardinality for string dims
– Partition by month for prune speed and cost
– TTL for retention
4) Aggregations for speed and cost
Pre-aggregate common metrics into rollup tables updated continuously.
– Daily user activity:
CREATE MATERIALIZED VIEW mv_events_to_daily
TO daily_user_activity AS
SELECT
tenant_id,
toDate(ts) AS d,
event,
uniqExact(user_id) AS uu
FROM product_events
GROUP BY tenant_id, d, event;
CREATE TABLE daily_user_activity (
tenant_id String,
d Date,
event LowCardinality(String),
uu UInt64
) ENGINE = ReplacingMergeTree()
ORDER BY (tenant_id, d, event);
– Sessionized funnels (optional): build session_start/session_end materialized views using window functions or handle in dbt.
5) Transformations with dbt (ClickHouse)
Use dbt-clickhouse for semantic models, derived metrics, and SCD dimensions.
– Models:
– stg_product_events: cast types, filter bad rows, standardize event names
– fct_event_counts_daily: DAU/WAU/MAU per tenant
– fct_funnels: configurable funnel steps by event and time window
– fct_retention: N-day retention by cohort_start = first_seen_date
Example dbt SQL idea:
select
tenant_id,
toDate(ts) as d,
countIf(event = ‘signup’) as signups,
uniqExactIf(user_id, event = ‘login’) as dau
from {{ ref(‘stg_product_events’) }}
group by tenant_id, d
6) Dashboards in Metabase
Connect Metabase directly to ClickHouse.
– Collections:
– Product KPIs: DAU/WAU/MAU, activation rate, feature adoption
– Growth: signups, conversion by channel (if captured)
– Reliability: event ingestion lag, API error rates
– Segmentation:
– Filters: tenant_id, plan, app_version, region
– Drill-through: user-level trails (guard with RBAC)
– Alerts:
– Pulses to Slack/Email when DAU drops > X% day-over-day
– Alert if ingestion lag > N minutes (query kafka table offsets vs. latest ts)
7) Health monitoring and SLIs
Track pipeline reliability separately from business metrics.
– Ingestion SLIs:
– HTTP 2xx rate and p95 latency for POST /events (Prometheus + FastAPI metrics)
– Backpressure count (producer queue size)
– Stream SLIs:
– Kafka consumer lag per partition (Redpanda metrics)
– Storage SLIs:
– ClickHouse insert errors, merges backlog, disk usage, parts count
– Dashboards:
– Grafana board combining FastAPI, Redpanda, ClickHouse exporters
– Alerts:
– Pager on consumer lag > threshold
– Disk usage > 80%
– Insert failures > 0.1% 5-min rate
8) Security and governance
– API: JWT per tenant, HMAC request signing, rate limits
– Data: avoid PII or hash client-side; encrypt at rest and in transit
– ClickHouse RBAC: read-only roles for BI, tenant row-level security using allow_read_policies
– Retention: enforce TTL; archive cold data to S3 via S3 table engine if needed
9) Deployment blueprint (Docker Compose)
Services:
– fastapi, redpanda, clickhouse, metabase, grafana, prometheus
– Optional: dbt runner (scheduled via cron/k8s Job)
Compose tips:
– Pin versions; mount persistent volumes for Redpanda/ClickHouse
– Separate networks for public API vs. internal data plane
– Set ClickHouse max_memory_usage, max_concurrent_queries
– Metabase env for ClickHouse driver; increase MB_JETTY_MAXTHREADS for load
10) Cost and performance notes
– Redpanda + ClickHouse can run on a single VM for MVP; scale to 3 nodes each later
– Expect 50k–200k events/sec on modest hardware with proper batching
– Keep event payloads < 2 KB; move large blobs to object storage
– Use materialized rollups for dashboards; avoid heavy ad-hoc scans during peak
11) Validation checklist
– Backfill: load historical CSV/Parquet to product_events via clickhouse-client
– Data quality: dbt tests for not_null, accepted_values, freshness
– Latency: end-to-end under 3s for most events
– Access: tenant-level filters enforced in Metabase
What you get
– Real-time dashboards that stay fast as volume grows
– Clear SLIs and actionable alerts
– A straightforward upgrade path from single node to HA
If you want a reference repo or a Compose file with sane defaults, reach out—we use this pattern in production for product analytics, ops telemetry, and feature adoption tracking.