This post shows how to deploy a lean, production-ready metrics pipeline for AI agents and automation workflows. The goal: near real-time visibility into latency, token/cost, error rates, tool call outcomes, and user/business impact.
Stack
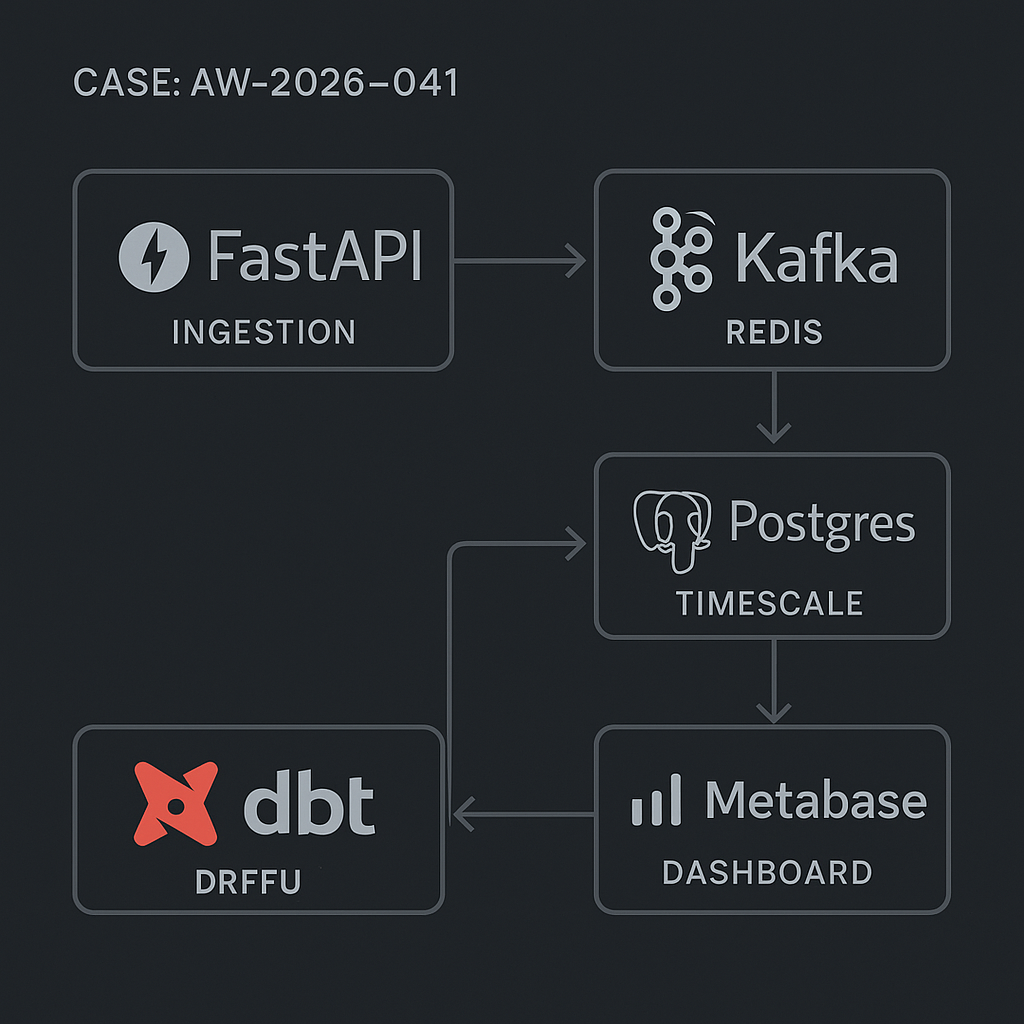
– Ingestion API: FastAPI
– Queue: Kafka (preferred) or Redis Streams
– Storage: Postgres with TimescaleDB (hypertables) or vanilla Postgres with partitioning
– Transform: dbt (metrics, aggregations, SLOs)
– Dashboard: Metabase (fast to stand up), optional Grafana for alerts
– Orchestration: Docker Compose or Kubernetes
– Auth: API key with HMAC signature
– Optional: Celery/Prefect for scheduled jobs
Event model (core)
Capture minimal, consistent events to avoid schema drift.
Event types:
– agent_run_started
– agent_run_finished
– tool_call
– llm_call
– error
– business_event (e.g., qualified_lead_created)
Shared envelope:
– event_id (uuid)
– event_type (text)
– occurred_at (timestamptz)
– workspace_id (text)
– session_id (text) // user/session/job
– actor_id (text) // user_id, service_id
– source (text) // web, worker, cron
– context (jsonb) // free-form
LLM fields (on llm_call, agent_run_finished):
– model (text)
– input_tokens (int)
– output_tokens (int)
– prompt_hash (text)
– latency_ms (int)
– success (bool)
– error_type (text null)
Tool fields (on tool_call):
– tool_name (text)
– status (text) // success, failure, timeout
– latency_ms (int)
Cost fields (optional):
– provider (text)
– unit_cost_input (numeric)
– unit_cost_output (numeric)
Postgres schema
Use TimescaleDB if available. Otherwise, native partitions by day.
SQL (core events):
CREATE TABLE IF NOT EXISTS ai_events (
event_id uuid PRIMARY KEY,
event_type text NOT NULL,
occurred_at timestamptz NOT NULL,
workspace_id text NOT NULL,
session_id text,
actor_id text,
source text,
model text,
input_tokens int,
output_tokens int,
prompt_hash text,
latency_ms int,
success boolean,
error_type text,
tool_name text,
status text,
provider text,
unit_cost_input numeric(10,6),
unit_cost_output numeric(10,6),
context jsonb
);
Indexes:
– CREATE INDEX ON ai_events (occurred_at DESC);
– CREATE INDEX ON ai_events (workspace_id, occurred_at DESC);
– CREATE INDEX ON ai_events (event_type, occurred_at DESC);
– CREATE INDEX ON ai_events (model);
– CREATE INDEX ON ai_events USING GIN (context);
Timescale hypertable:
SELECT create_hypertable(‘ai_events’, by_range(‘occurred_at’), if_not_exists => true);
Partitioning fallback:
– Daily partitions via trigger or pg_partman.
– Retention policy: keep raw 30-90 days; aggregate forever.
Ingestion API (FastAPI)
– Accept batched events (up to 100).
– Verify HMAC signature.
– Validate via Pydantic.
– Push to Kafka topic ai_events or Redis stream ai_events.
Example (simplified):
from fastapi import FastAPI, Request, HTTPException
from pydantic import BaseModel, Field
import hmac, hashlib, json, os
from datetime import datetime
from aiokafka import AIOKafkaProducer
SECRET = os.getenv(“INGEST_SECRET”)
KAFKA_BOOTSTRAP = os.getenv(“KAFKA_BOOTSTRAP”)
class Event(BaseModel):
event_id: str
event_type: str
occurred_at: datetime
workspace_id: str
session_id: str | None = None
actor_id: str | None = None
source: str | None = None
model: str | None = None
input_tokens: int | None = None
output_tokens: int | None = None
prompt_hash: str | None = None
latency_ms: int | None = None
success: bool | None = None
error_type: str | None = None
tool_name: str | None = None
status: str | None = None
provider: str | None = None
unit_cost_input: float | None = None
unit_cost_output: float | None = None
context: dict | None = None
class Batch(BaseModel):
events: list[Event] = Field(…, min_items=1, max_items=100)
app = FastAPI()
producer = None
@app.on_event(“startup”)
async def start():
global producer
producer = AIOKafkaProducer(bootstrap_servers=KAFKA_BOOTSTRAP)
await producer.start()
@app.on_event(“shutdown”)
async def stop():
await producer.stop()
def verify_sig(raw_body: bytes, sig: str):
mac = hmac.new(SECRET.encode(), raw_body, hashlib.sha256).hexdigest()
return hmac.compare_digest(mac, sig)
@app.post(“/ingest”)
async def ingest(request: Request):
raw = await request.body()
sig = request.headers.get(“X-Signature”) or “”
if not verify_sig(raw, sig):
raise HTTPException(401, “invalid signature”)
payload = Batch.model_validate_json(raw)
for e in payload.events:
await producer.send_and_wait(“ai_events”, json.dumps(e.model_dump()).encode())
return {“ok”: True, “count”: len(payload.events)}
Consumer (Kafka -> Postgres)
– Use a single writer per partition.
– Idempotent upsert on event_id.
Pseudo:
INSERT INTO ai_events (…) VALUES (…)
ON CONFLICT (event_id) DO NOTHING;
DBT models
Create clean aggregates for dashboards and SLOs.
models/marts/metrics/llm_daily.sql:
select
date_trunc(‘day’, occurred_at) as day,
workspace_id,
model,
count(*) filter (where event_type=’llm_call’) as calls,
percentile_cont(0.5) within group (order by latency_ms) as p50_latency_ms,
percentile_cont(0.9) within group (order by latency_ms) as p90_latency_ms,
sum(coalesce(input_tokens,0)) as input_tokens,
sum(coalesce(output_tokens,0)) as output_tokens,
sum(
coalesce(input_tokens,0)*coalesce(unit_cost_input,0)
+ coalesce(output_tokens,0)*coalesce(unit_cost_output,0)
) as cost_usd,
1.0*sum(case when success then 1 else 0 end)/nullif(count(*),0) as success_rate
from {{ ref(‘stg_ai_events’) }}
where event_type in (‘llm_call’,’agent_run_finished’)
group by 1,2,3;
models/marts/metrics/tool_reliability.sql:
select
date_trunc(‘hour’, occurred_at) as hour,
workspace_id,
tool_name,
count(*) as calls,
1.0*sum(case when status=’success’ then 1 else 0 end)/nullif(count(*),0) as success_rate,
avg(latency_ms) as avg_latency_ms
from {{ ref(‘stg_ai_events’) }}
where event_type=’tool_call’
group by 1,2,3;
SLOs and alerts
– Error budget: 99% success_rate per day on agent_run_finished.
– Latency SLO: p90_latency_ms < target per model.
– Cost guardrail: cost_usd per workspace per day threshold.
Metabase setup
Dashboards (suggested cards):
– LLM Overview
– Calls by model (daily)
– p50/p90 latency by model
– Token in/out trend
– Cost by model/provider
– Success rate over time
– Tool Reliability
– Success rate by tool (hourly)
– Failures by error_type
– Timeouts trend
– Agent Health
– Agent run success rate
– Average steps per run (from context.step_count)
– Top failing prompts (prompt_hash)
– Workspace Billing
– Daily cost per workspace
– Anomalies (z-score on daily spend)
Metabase tips
– Use SQL-native queries on dbt models.
– Add filters for workspace_id, model, date range.
– Cache at 5–15 minutes for near real-time.
– Create pulses (email/Slack) for SLO breaches.
Performance considerations
– Prefer Kafka with 3 partitions for steady ingestion; scale consumers horizontally.
– Batch inserts of 500–5k rows with COPY when backfilling.
– For Timescale: compress chunks older than 3 days; set retention to 90 days on raw.
– For vanilla Postgres: daily partitions + BRIN index on occurred_at.
– Keep jsonb context small; move hot keys to top-level columns when used in WHERE/JOIN.
– Use prompt_hash, not raw prompts, to avoid PII and save space.
Security and compliance
– HMAC signatures on ingest; rotate keys.
– Encrypt at rest (cloud-managed).
– Avoid logging raw user content; hash or redact.
– Separate writer and reader roles; Metabase gets read-only.
Deployment notes
– Docker Compose: kafka, zookeeper, postgres+timescale, fastapi, consumer, metabase.
– Health checks for producer/consumer.
– Use DLQ (dead-letter) topic for schema errors.
– Add OpenTelemetry tracing IDs to correlate events with app logs.
Quick wins
– If you don’t need Kafka, use Redis Streams; swap AIOKafka for aioredis and run a single consumer.
– If you need only dashboards, push events directly to Postgres via an async queue in the API and scale DB vertically.
What you get
– Real-time visibility into agent/LLM performance and cost.
– Traceable tool failures with impact by workspace.
– Guardrails with alerts to prevent runaway spend.
– A path to scale with minimal rework.
This is a great breakdown of a robust, self-hosted observability stack. How have you found this approach to compare against managed solutions in terms of flexibility and long-term cost?
It’s a good trade-off to frame as control vs convenience. Self-hosted tends to win on flexibility (custom event model, dbt logic, retention/PII handling, vendor-agnostic dashboards), while managed tends to win on time-to-value and ongoing ops (upgrades, scaling, on-call, built-in alerting/SLO features).
On long-term cost, the biggest drivers I’ve seen are (1) event volume/egress, (2) retention windows, and (3) how much engineer time you spend operating Kafka/Redis + Postgres/Timescale (plus backups and incident response). Managed costs can climb quickly with high-cardinality metrics and long retention, but self-hosting can “cost” you in staffing and reliability work.
A couple clarifying questions: are you mostly optimizing for low-latency near-real-time dashboards, or audit-grade retention and replay? And roughly what’s your expected event rate/retention target (e.g., days vs months)? Those two usually decide whether managed stays predictable or becomes the expensive option.
Thanks for clarifying; we’re optimizing for audit-grade retention over several months rather than low-latency dashboards.