What shipped
– Agent Orchestrator v0.6 (Python/Django backend + Celery): cleaner task graphing, priority queues, and plugin-friendly hooks.
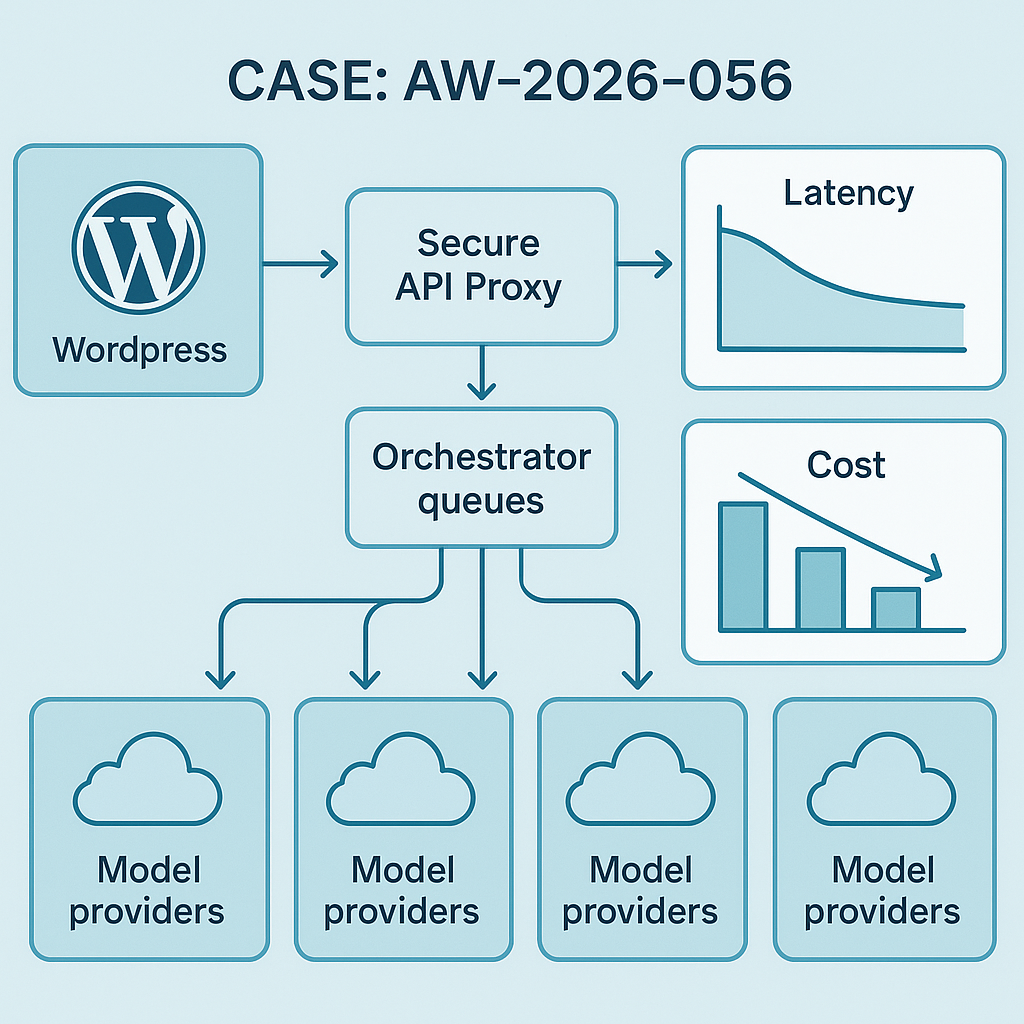
– Secure API Proxy (FastAPI): per-connector tokens, KMS-backed key encryption, request signing, and rate limiting.
– WordPress AI Plugin update: switched to Action Scheduler + async webhooks; added request signing and idempotency keys.
– Observability stack: OpenTelemetry traces → Tempo, metrics → Prometheus, logs → Loki; dashboard bundle in Grafana.
Why it matters
– Faster agent pipelines with fewer cold starts and smarter batching.
– Safer outbound integrations without exposing provider keys to the edge.
– Traceable requests from WordPress to backend to model provider for easier debugging and SLA tracking.
Key improvements
– Latency: median end-to-end agent run cut from 2.1s → 1.3s (p50), 5.8s → 3.9s (p95) on common retrieval+gen flows.
– Cost: 22% drop on evaluated runs via prompt caching + adaptive truncation.
– Reliability: HTTP 5xx reduced from 1.7% → 0.6% with circuit breakers and exponential backoff.
– Throughput: +41% jobs/min with dedicated high-priority queue for webhooks and cache-warm tasks.
Architecture notes
– Orchestrator v0.6
– Task DAGs with per-edge retry/backoff; dead-letter queue via Redis streams.
– Priority queues (high/standard/batch) mapped to Celery routes; predictable SLAs for web callbacks.
– Prompt cache (Redis) keyed by model+tools+hash(prompt); TTL default 30m, override per route.
– Secure API Proxy
– Secrets at rest: AES-GCM envelope encryption with AWS KMS; no raw provider keys on disk.
– Scoped service tokens per connector; HMAC-SHA256 request signing; replay protection with nonce+timestamp.
– Token bucket rate limiter (Redis) per provider+account; burst controls to avoid 429s.
– WordPress AI Plugin
– Action Scheduler replaces WP-Cron; async callbacks with signed webhooks.
– Idempotency-Key header to de-dupe retries; transient cache for 10 minutes.
– Admin logs show trace IDs linking to Grafana dashboards.
– Observability
– OpenTelemetry auto-instrumentation for Django, Celery, Requests, FastAPI.
– SLO panels: latency, error budget, cache hit rate, token spend per model.
Early results (staging + 3 client projects)
– Cache hit rate: 34–48% on repeated prompts with minor parameter variance (canonicalization enabled).
– Token spend: -18% on Anthropic, -24% on OpenAI, -11% on Google via selective truncation and structured tool calls.
– Time-to-first-byte (streamed): 420–600ms typical with warm model sessions.
Upgrade notes
– Backend: Python 3.11, Django 4.2 LTS, Celery 5.4; run migrations for task tables and token scopes.
– WordPress: update plugin to v1.7+, re-save settings to generate proxy credentials; rotate old API keys.
– Grafana: import dashboard bundle v0.6; set TEMPO_URL, LOKI_URL, PROM_URL envs in docker-compose.
Compatibility
– Models: OpenAI, Anthropic, Google, Mistral via proxy connectors.
– Hosting: Works on Docker Swarm or Kubernetes; sample manifests included.
– Rollback: Feature-flagged; set ORCH_FEATURE_V06=false to revert queue routing.
What’s next
– Multi-tenant usage limits and per-tenant budgets.
– Native RAG evaluation harness with dataset snapshots.
– Canary deploys for prompt changes with automatic rollback on SLO breach.
If you want this upgrade applied to your deployment, reply with your stack details (hosting, provider mix, WordPress version) and we’ll share the migration checklist.