Overview
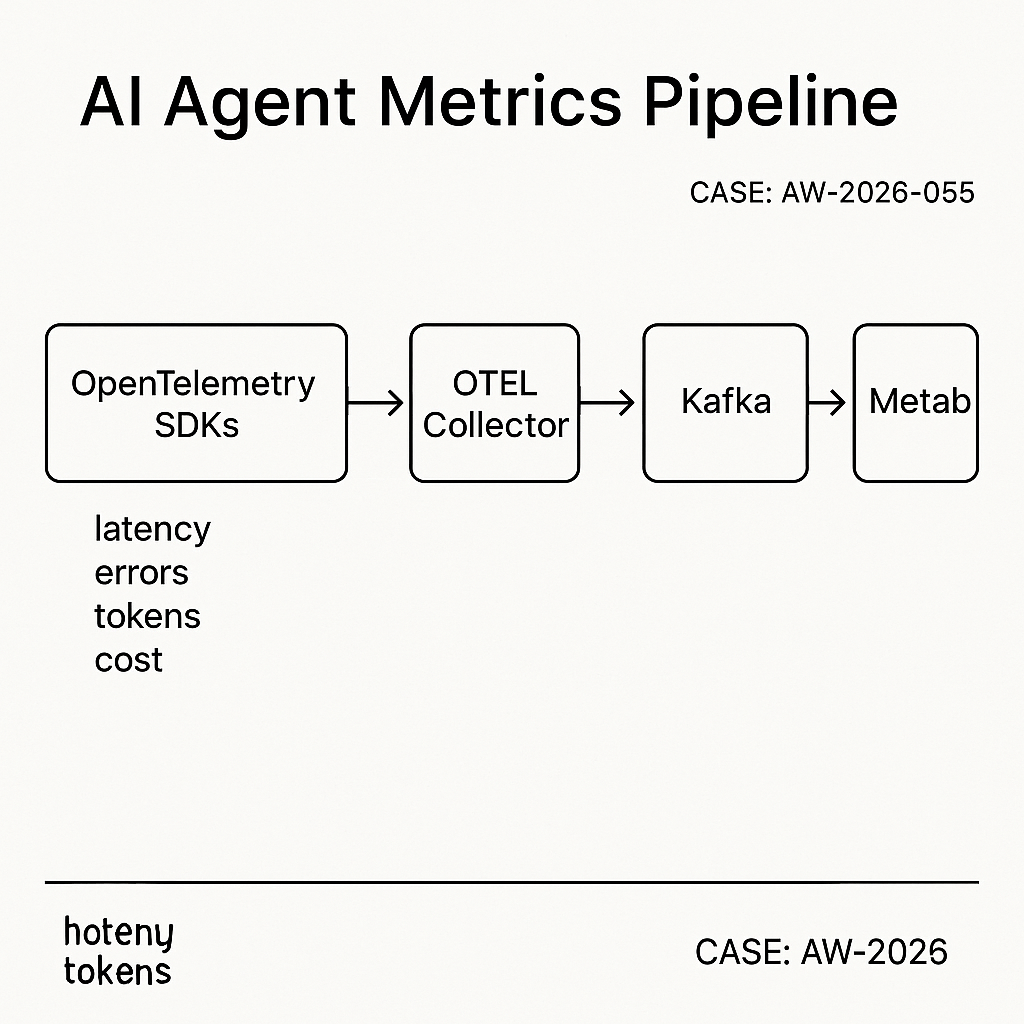
This build logs AI agent metrics in near real time, scales to millions of events/day, and keeps query latency under 200 ms. It uses:
– OpenTelemetry SDKs to emit spans/metrics
– OpenTelemetry Collector to batch and forward
– Kafka for durable buffering
– ClickHouse for fast analytics
– Metabase for dashboards and alerts
Use cases
– Track request latency, token usage, cost per endpoint
– Error rates by model/provider
– Agent step timings and tool success
– Customer-level SLOs and anomaly alerts
Architecture
– Services/agents emit OTLP spans and metrics.
– Otel Collector scrubs PII, batches, retries.
– Kafka provides backpressure and replay.
– ClickHouse ingests via Kafka Engine to a MergeTree.
– Metabase connects directly to ClickHouse.
Data model
Two core tables keep it simple and fast:
– agent_events: per request/step event (span-like)
– ts (DateTime64), trace_id, span_id, parent_span_id
– service, env, agent, model, provider
– route, user_id_hash, status, error_type
– latency_ms, tokens_prompt, tokens_completion, cost_usd
– attrs (JSON)
– agent_metrics_1m: rollups by minute
– ts_min, service, env, agent, model, route
– calls, p50_ms, p95_ms, error_rate, tokens_total, cost_usd
ClickHouse DDL
— Raw Kafka topic table
CREATE TABLE kafka_agent_events (
ts DateTime64(3),
trace_id String,
span_id String,
parent_span_id String,
service LowCardinality(String),
env LowCardinality(String),
agent LowCardinality(String),
model LowCardinality(String),
provider LowCardinality(String),
route LowCardinality(String),
user_id_hash FixedString(32),
status LowCardinality(String),
error_type LowCardinality(String),
latency_ms UInt32,
tokens_prompt UInt32,
tokens_completion UInt32,
cost_usd Decimal(12,6),
attrs JSON
) ENGINE = Kafka
SETTINGS
kafka_broker_list = ‘kafka:9092’,
kafka_topic_list = ‘agent_events_v1’,
kafka_group_name = ‘ch_agent_events_ingest’,
kafka_format = ‘JSONEachRow’,
kafka_num_consumers = 4;
— Final storage
CREATE TABLE agent_events (
ts DateTime64(3),
trace_id String,
span_id String,
parent_span_id String,
service LowCardinality(String),
env LowCardinality(String),
agent LowCardinality(String),
model LowCardinality(String),
provider LowCardinality(String),
route LowCardinality(String),
user_id_hash FixedString(32),
status LowCardinality(String),
error_type LowCardinality(String),
latency_ms UInt32,
tokens_prompt UInt32,
tokens_completion UInt32,
cost_usd Decimal(12,6),
attrs JSON
)
ENGINE = MergeTree
PARTITION BY toYYYYMM(ts)
ORDER BY (ts, service, env, agent, route)
TTL ts + INTERVAL 90 DAY DELETE;
— Streaming materialization
CREATE MATERIALIZED VIEW mv_agent_events TO agent_events AS
SELECT
ts, trace_id, span_id, parent_span_id,
service, env, agent, model, provider, route,
user_id_hash, status, error_type,
latency_ms, tokens_prompt, tokens_completion, cost_usd, attrs
FROM kafka_agent_events;
— Rollup by minute
CREATE MATERIALIZED VIEW mv_agent_metrics_1m
ENGINE = SummingMergeTree
PARTITION BY toYYYYMM(ts_min)
ORDER BY (ts_min, service, env, agent, model, route)
AS
SELECT
toStartOfMinute(ts) AS ts_min,
service, env, agent, model, route,
count() AS calls,
quantileExact(0.5)(latency_ms) AS p50_ms,
quantileExact(0.95)(latency_ms) AS p95_ms,
sumIf(1, status != ‘ok’) / count() AS error_rate,
sum(tokens_prompt + tokens_completion) AS tokens_total,
sum(cost_usd) AS cost_usd
FROM agent_events
GROUP BY ts_min, service, env, agent, model, route;
OpenTelemetry Collector config
Receives spans/metrics over OTLP, drops PII, batches, pushes to Kafka.
receivers:
otlp:
protocols:
http:
grpc:
processors:
attributes:
actions:
– key: user_email
action: delete
– key: user_id
action: hash
batch:
timeout: 2s
send_batch_size: 5000
memory_limiter:
check_interval: 5s
limit_mib: 512
spike_limit_mib: 256
transform:
error_mode: ignore
traces:
– set(name, Concat(attributes[“agent”], “:”, attributes[“route”])) where name == “”
exporters:
kafka:
brokers: [ “kafka:9092” ]
topic: agent_events_v1
encoding: json
balancer: round_robin
retry_on_failure:
enabled: true
max_elapsed_time: 120s
service:
pipelines:
traces:
receivers: [otlp]
processors: [memory_limiter, attributes, transform, batch]
exporters: [kafka]
metrics:
receivers: [otlp]
processors: [memory_limiter, batch]
exporters: [kafka]
Client emission example (Python)
from opentelemetry import trace
from opentelemetry.exporter.otlp.proto.http.trace_exporter import OTLPSpanExporter
from opentelemetry.sdk.trace import TracerProvider
from opentelemetry.sdk.resources import Resource
from opentelemetry.sdk.trace.export import BatchSpanProcessor
provider = TracerProvider(resource=Resource.create({
“service.name”: “api”,
“deployment.environment”: “prod”,
“agent”: “order_bot”,
“model”: “gpt-4.1”,
“provider”: “openai”,
“route”: “POST /v1/answer”
}))
trace.set_tracer_provider(provider)
processor = BatchSpanProcessor(OTLPSpanExporter(endpoint=”http://otel-collector:4318/v1/traces”))
provider.add_span_processor(processor)
with trace.get_tracer(“api”).start_as_current_span(“agent_step”) as span:
# do work…
span.set_attribute(“tokens_prompt”, 512)
span.set_attribute(“tokens_completion”, 128)
span.set_attribute(“cost_usd”, 0.0032)
span.set_attribute(“status”, “ok”)
span.set_attribute(“user_id”, “12345”) # will be hashed by Collector
Metabase setup
– Add ClickHouse as a database (native driver).
– Set sync/scan to hourly for new fields.
– Create questions using native SQL.
Useful queries
– Errors by model (last 24h):
SELECT model, provider, count() AS errors
FROM agent_events
WHERE ts > now() – INTERVAL 1 DAY AND status != ‘ok’
GROUP BY model, provider
ORDER BY errors DESC
LIMIT 20;
– P95 latency by route (last 7d):
SELECT route, round(quantile(0.95)(latency_ms)) AS p95_ms, count() AS calls
FROM agent_events
WHERE ts > now() – INTERVAL 7 DAY
GROUP BY route
ORDER BY p95_ms DESC;
– Cost by customer (requires user_id map):
SELECT user_id_hash, sum(cost_usd) AS cost
FROM agent_events
WHERE ts > now() – INTERVAL 30 DAY
GROUP BY user_id_hash
ORDER BY cost DESC
LIMIT 50;
– SLO burn (errors > 2% in 15m windows):
SELECT
toStartOfInterval(ts, INTERVAL 15 minute) AS win,
round(avg(status != ‘ok’) * 100, 2) AS error_pct
FROM agent_events
WHERE ts > now() – INTERVAL 1 DAY
GROUP BY win
ORDER BY win DESC;
Alerting pattern
– Use a saved question with a threshold and Metabase email/Slack alerts.
– For low-latency alerts, add a lightweight worker polling ClickHouse every minute and posting to Slack webhook if error_pct > threshold.
Performance notes
– ClickHouse tuning:
– Use LowCardinality for strings; keep ORDER BY narrow and aligned with filters.
– Prefer DateTime64 for precise latency windows.
– Use TTL to control storage; hot data on fast disks.
– Kafka:
– Start with 3 partitions; increase to match ingest QPS.
– Retain 24–48h for replay.
– Otel Collector:
– Batch size 5k–10k; enable compression if cross-AZ.
– Cost:
– ClickHouse on a single NVMe host handles 50–100k events/sec; scale via shards + replicas.
Security and compliance
– Hash or drop user PII at the Collector.
– Restrict Metabase to read-only users.
– Use network policies or private subnets; encrypt Kafka and ClickHouse at rest and in transit.
– Rotate Kafka credentials and ClickHouse users; audit queries.
Deployment tips
– Docker Compose for a single-node pilot; Terraform + Kubernetes for prod.
– Health checks: Kafka consumer lag, Otel Collector queue size, ClickHouse insert delays.
– Backfill by producing historical JSON to the Kafka topic; ClickHouse will materialize.
What to build next
– Enrich events with billing account or feature flags.
– Add model drift metrics (output length, refusal rate).
– Expose a public status dashboard per-customer via Metabase embeds.