This build logs every AI agent run, tool call, token usage, latency, and error into a low-latency analytics stack you can operate. It is optimized for high write throughput, cheap retention, and fast aggregations.
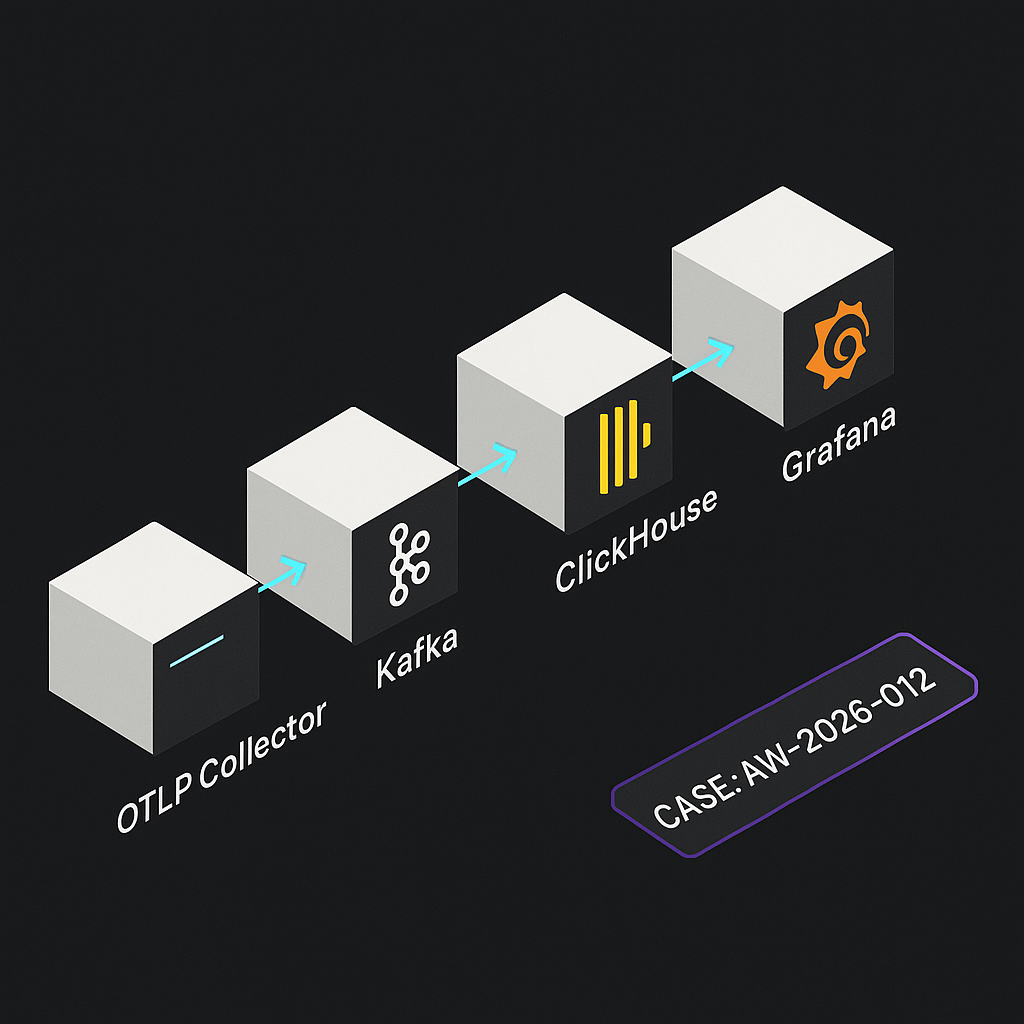
Architecture
– Ingest: OpenTelemetry OTLP HTTP (collector) receives spans/events from agents, services, and workers.
– Queue: Kafka buffers bursts and decouples ingestion from storage.
– Storage: ClickHouse stores normalized spans and derived rollups via materialized views.
– Visualization: Grafana queries ClickHouse for real-time dashboards and SLOs.
– Optional: S3 object storage for cheap parquet archives via ClickHouse TTL + MOVES.
Data model
– Trace-level: trace_id, span_id, parent_span_id, service_name, operation, status_code, start_ts, end_ts, duration_ms, attributes (map), tenant_id, env.
– Event-level: event_ts, event_type, trace_id, payload_json, tenant_id, cost_usd, tokens_prompt, tokens_completion, model, tool_name.
– Derived rollups: per-minute and per-tenant aggregates for latency, error_rate, cost, token_count.
Docker Compose (minimal dev)
– Services: otel-collector, kafka, zookeeper, clickhouse-server, clickhouse-init (one-shot DDL), grafana.
– Expose:
– OTLP HTTP: 4318
– ClickHouse HTTP: 8123, Native: 9000
– Grafana: 3000
– Kafka: 9092 (internal), 29092 (host)
otel-collector.yaml (key points)
– receivers:
– otlp: protocols http
– processors:
– batch
– attributes (add env, tenant_id if available)
– exporters:
– kafka (topic: otel-spans, encoding: otlp_json)
– service:
– pipelines:
– traces: otlp -> batch -> kafka
Kafka topics
– otel-spans (partitions: 6+ for throughput)
– otel-events (optional for custom events)
– Use compression lz4 or zstd. Replication 3 in prod.
ClickHouse schema (core)
– Table: spans_raw (MergeTree)
– Columns: as above, plus attributes_json JSON
– Order by: (tenant_id, toDate(start_ts), service_name, operation, start_ts)
– TTL: start_ts + INTERVAL 30 DAY TO VOLUME ‘slow’, start_ts + INTERVAL 180 DAY DELETE
– Table: events_raw (MergeTree)
– Order by: (tenant_id, toDate(event_ts), event_type, event_ts)
– Kafka engines:
– spans_kafka ENGINE = Kafka reading topic otel-spans, format JSONEachRow
– Materialized view mv_spans_raw inserts into spans_raw with JSON extraction and type casting
– Rollups:
– mv_span_minute aggregates to spans_minute (AggregatingMergeTree) with quantiles and counts
– mv_cost_minute aggregates token and cost fields
Example ClickHouse DDL (abridged)
– Create database telemetry;
– Create table telemetry.spans_raw (…)
ENGINE = MergeTree
ORDER BY (tenant_id, toDate(start_ts), service_name, operation, start_ts)
TTL start_ts + INTERVAL 90 DAY DELETE;
– Create table telemetry.spans_kafka (…)
ENGINE = Kafka
SETTINGS kafka_broker_list=’kafka:9092′, kafka_topic_list=’otel-spans’, kafka_group_name=’ch-spans’, kafka_format=’JSONEachRow’;
– Create materialized view telemetry.mv_spans_raw TO telemetry.spans_raw AS
SELECT
JSON_VALUE(_raw, ‘$.traceId’) AS trace_id,
JSON_VALUE(_raw, ‘$.spanId’) AS span_id,
…
FROM telemetry.spans_kafka;
– Create table telemetry.spans_minute (…)
ENGINE = AggregatingMergeTree
ORDER BY (tenant_id, service_name, operation, toStartOfMinute(start_ts));
– Create materialized view telemetry.mv_spans_minute TO telemetry.spans_minute AS
SELECT
tenant_id, service_name, operation, toStartOfMinute(start_ts) AS ts_min,
countState() AS c,
quantilesTimingState(0.5,0.9,0.99)(duration_ms) AS q,
sumState(if(status_code!=’OK’,1,0)) AS errors
FROM telemetry.spans_raw
GROUP BY tenant_id, service_name, operation, ts_min;
Ingest from Python agents (OTLP)
– Install: pip install opentelemetry-sdk opentelemetry-exporter-otlp
– Configure:
– OTEL_EXPORTER_OTLP_ENDPOINT=http://otel-collector:4318
– Resource attributes: service.name, deployment.environment, tenant.id
– Emit spans per agent run and tool call. Add attributes:
– model, tokens.prompt, tokens.completion, cost.usd, user_id, workflow_id, tool_name.
Example Grafana panels
– Latency: SELECT quantilesExact(0.5,0.9,0.99)(duration_ms) FROM spans_raw WHERE tenant_id=$tenant AND $__timeFilter(start_ts) GROUP BY bin( start_ts, 1m )
– Error rate: sum(errors)/sum(c) from spans_minute
– Cost $: sum(cost_usd) from events_raw or spans_raw attributes over time and by model
– Throughput: countDistinct(trace_id) per minute
– SLOs:
– Availability: 1 – (errors / c)
– Latency objective: P95(duration_ms) 2% for 5m
– P95 latency > target for 10m
– Cost per minute spike vs 7d baseline
– No data (ingestion stalled) for 5m
What this enables
– Real-time visibility into agent reliability, latency, token spend, and tool performance.
– Fast drilldowns by tenant, model, workflow, and tool to debug regressions.
– Predictable cost with cheap storage and controllable retention.
Repo starter checklist
– docker-compose.yml with all services and volumes
– otel-collector.yaml
– clickhouse-init.sql for tables, topics, views, and users
– grafana-provisioning dashboards and datasources
– Makefile targets: up, down, logs, migrate, backfill