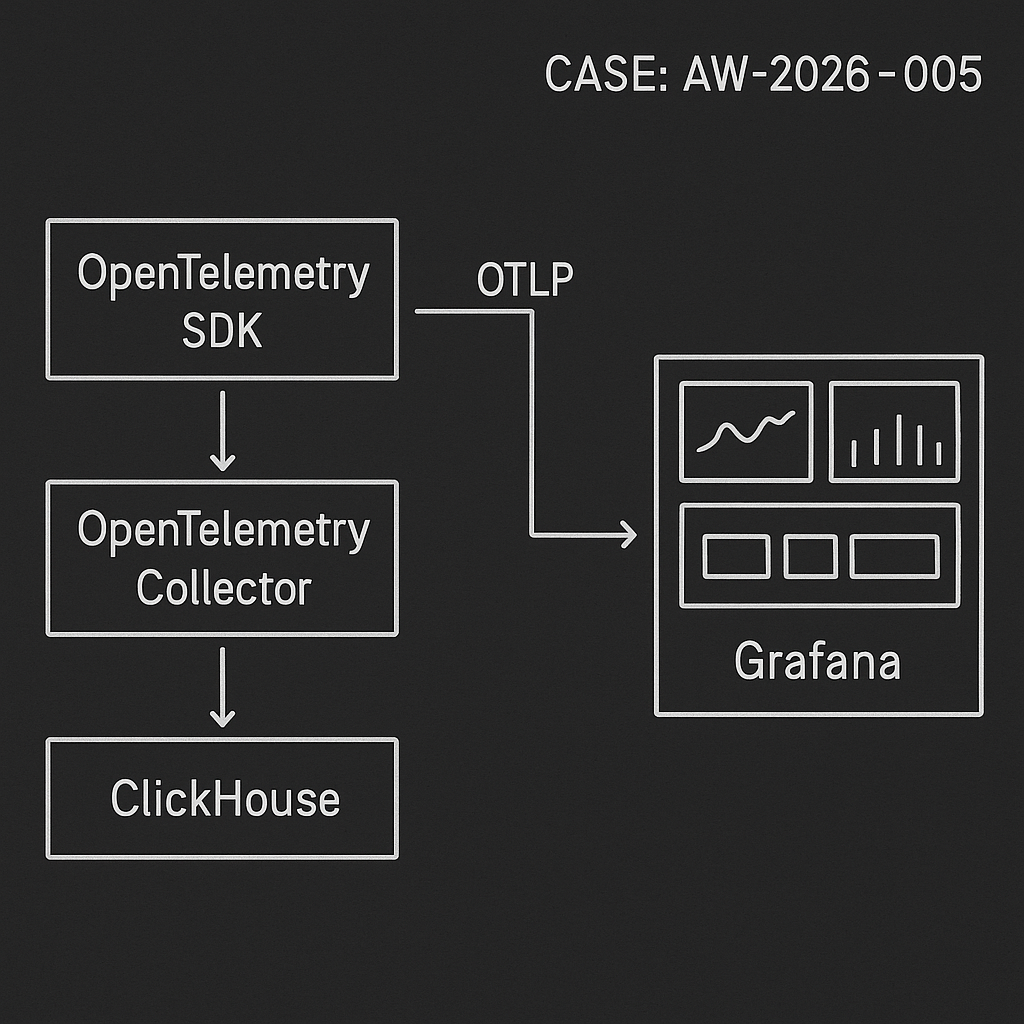
This post ships a real, minimal LLM ops pipeline for metrics, traces, and logs:
– OpenTelemetry SDK (your services) -> OTLP -> OpenTelemetry Collector
– Collector -> ClickHouse (fast, columnar, cheap)
– Grafana -> ClickHouse for dashboards and alerting
Why this stack:
– OTLP is a standard you can use across Python, Node, Go, and edge functions.
– ClickHouse handles high-cardinality metrics and traces at low cost.
– Grafana reads ClickHouse directly with a mature plugin.
What you get
– Docker Compose to run everything locally or on a small VM.
– OpenTelemetry Collector config with ClickHouse exporter.
– Python example for emitting traces, metrics, and logs.
– ClickHouse retention/partitioning for predictable costs.
– Example Grafana queries to visualize agent quality and latency.
Prerequisites
– Docker + Docker Compose
– A domain or IP (optional, for remote access)
– Grafana ClickHouse data source plugin (ID: vertamedia-clickhouse-datasource)
1) Docker Compose
Create docker-compose.yml:
version: “3.8”
services:
clickhouse:
image: clickhouse/clickhouse-server:24.1
container_name: clickhouse
ports:
– “8123:8123” # HTTP
– “9000:9000” # Native
volumes:
– ch-data:/var/lib/clickhouse
– ./clickhouse/config.d:/etc/clickhouse-server/config.d
– ./clickhouse/users.d:/etc/clickhouse-server/users.d
ulimits:
nofile:
soft: 262144
hard: 262144
otel-collector:
image: otel/opentelemetry-collector-contrib:0.100.0
container_name: otel-collector
command: [“–config=/etc/otelcol/config.yaml”]
volumes:
– ./otel/config.yaml:/etc/otelcol/config.yaml
ports:
– “4317:4317” # OTLP gRPC
– “4318:4318” # OTLP HTTP
depends_on:
– clickhouse
grafana:
image: grafana/grafana:10.4.3
container_name: grafana
ports:
– “3000:3000”
environment:
– GF_INSTALL_PLUGINS=vertamedia-clickhouse-datasource
volumes:
– grafana-data:/var/lib/grafana
depends_on:
– clickhouse
volumes:
ch-data:
grafana-data:
2) ClickHouse minimal config (auth + profiles)
Create clickhouse/users.d/users.xml:
::/0
default
default
otel_password
::/0
default
default
Optional hardening (recommended for internet-facing):
– Bind to private network only and proxy via VPN or Tailscale.
– Create dedicated DB and user with limited privileges.
3) OpenTelemetry Collector config
Create otel/config.yaml:
receivers:
otlp:
protocols:
grpc:
http:
processors:
batch:
send_batch_size: 8192
timeout: 5s
memory_limiter:
check_interval: 5s
limit_mib: 512
spike_limit_mib: 256
attributes:
actions:
– key: service.environment
action: insert
value: prod
exporters:
clickhouse:
endpoint: tcp://clickhouse:9000?secure=false
database: otel
ttl: 168h # 7 days default retention; we’ll add TTLs too
username: otel
password: otel_password
create_schema: true
logs_table_name: otel_logs
traces_table_name: otel_traces
metrics_table_name: otel_metrics
timeout: 10s
service:
pipelines:
traces:
receivers: [otlp]
processors: [memory_limiter, batch]
exporters: [clickhouse]
metrics:
receivers: [otlp]
processors: [memory_limiter, batch]
exporters: [clickhouse]
logs:
receivers: [otlp]
processors: [memory_limiter, batch]
exporters: [clickhouse]
Notes:
– clickhouse exporter auto-creates schema when create_schema: true.
– You can split pipelines by environment or service using routing processors.
4) Start the stack
docker compose up -d
– ClickHouse UI (HTTP): http://localhost:8123
– Grafana: http://localhost:3000 (admin/admin by default)
– OTLP endpoint: grpc http://localhost:4317, http http://localhost:4318
5) Emit data from Python (traces, metrics, logs)
Install:
pip install opentelemetry-sdk opentelemetry-exporter-otlp opentelemetry-instrumentation-requests opentelemetry-api
Sample app (app.py):
import time
import random
import requests
from opentelemetry import trace, metrics
from opentelemetry.sdk.resources import Resource
from opentelemetry.sdk.trace import TracerProvider
from opentelemetry.sdk.trace.export import BatchSpanProcessor
from opentelemetry.exporter.otlp.proto.grpc.trace_exporter import OTLPSpanExporter
from opentelemetry.sdk.metrics import MeterProvider
from opentelemetry.exporter.otlp.proto.grpc.metric_exporter import OTLPMetricExporter
from opentelemetry.sdk.metrics.export import PeriodicExportingMetricReader
from opentelemetry.sdk._logs import LoggerProvider
from opentelemetry.sdk._logs.export import BatchLogRecordProcessor
from opentelemetry.exporter.otlp.proto.grpc._log_exporter import OTLPLogExporter
from opentelemetry._logs import set_logger_provider
resource = Resource.create({
“service.name”: “agent-orchestrator”,
“service.version”: “1.2.3”,
“service.environment”: “prod”,
“deployment.region”: “us-west-2″,
})
# Traces
trace.set_tracer_provider(TracerProvider(resource=resource))
tracer = trace.get_tracer(__name__)
span_exporter = OTLPSpanExporter(endpoint=”http://localhost:4317″, insecure=True)
trace.get_tracer_provider().add_span_processor(BatchSpanProcessor(span_exporter))
# Metrics
metric_exporter = OTLPMetricExporter(endpoint=”http://localhost:4317”, insecure=True)
reader = PeriodicExportingMetricReader(metric_exporter, export_interval_millis=5000)
metrics.set_meter_provider(MeterProvider(resource=resource, metric_readers=[reader]))
meter = metrics.get_meter(“agent-metrics”)
latency_hist = meter.create_histogram(“agent.response_latency_ms”)
tokens_counter = meter.create_counter(“agent.output_tokens”)
success_counter = meter.create_counter(“agent.success”)
# Logs
logger_provider = LoggerProvider(resource=resource)
set_logger_provider(logger_provider)
log_exporter = OTLPLogExporter(endpoint=”http://localhost:4317″, insecure=True)
logger_provider.add_log_record_processor(BatchLogRecordProcessor(log_exporter))
logger = logger_provider.get_logger(“agent-logger”)
def call_model(prompt):
# fake work
start = time.time()
time.sleep(random.uniform(0.05, 0.4))
tokens = random.randint(50, 400)
ok = random.random() > 0.1
duration_ms = (time.time() – start) * 1000
attributes = {“model”: “gpt-4o-mini”, “route”: “answer”, “customer_tier”: “pro”}
latency_hist.record(duration_ms, attributes)
tokens_counter.add(tokens, attributes)
success_counter.add(1 if ok else 0, attributes)
with tracer.start_as_current_span(“llm.call”, attributes=attributes) as span:
span.set_attribute(“llm.prompt.len”, len(prompt))
span.set_attribute(“llm.tokens”, tokens)
if not ok:
span.set_attribute(“error”, True)
logger.error(“agent failure”, extra={“attributes”: attributes})
else:
logger.info(“agent success”, extra={“attributes”: attributes})
return ok, tokens, duration_ms
if __name__ == “__main__”:
while True:
call_model(“hello”)
time.sleep(1)
Run:
python app.py
6) Verify data landed
In ClickHouse:
– Show DBs: SHOW DATABASES;
– Data lives in database otel with tables otel_traces, otel_metrics, otel_logs (names from exporter).
– Basic checks:
SELECT count() FROM otel.otel_traces;
SELECT count() FROM otel.otel_metrics;
SELECT count() FROM otel.otel_logs;
7) Retention, partitioning, and compression
For cost control, add TTL and partitioning. If you let the exporter create schema, alter tables:
ALTER TABLE otel.otel_traces
MODIFY TTL toDateTime(timestamp) + INTERVAL 7 DAY
SETTINGS storage_policy = ‘default’;
ALTER TABLE otel.otel_metrics
MODIFY TTL toDateTime(timestamp) + INTERVAL 30 DAY;
ALTER TABLE otel.otel_logs
MODIFY TTL toDateTime(timestamp) + INTERVAL 14 DAY;
Optional: create your own tables with partitions by toYYYYMMDD(timestamp) and codecs (ZSTD(6)) for lower storage.
8) Grafana data source
– Login to Grafana -> Connections -> Data sources -> Add data source -> ClickHouse.
– URL: http://clickhouse:8123
– Auth: username otel, password otel_password
– Default database: otel
– Confirm connection.
9) Example Grafana panels (SQL)
– Agent P50/P95 latency (ms) by model, 15m
SELECT
model,
quantile(0.5)(value) AS p50,
quantile(0.95)(value) AS p95,
toStartOfInterval(timestamp, INTERVAL 15 minute) AS ts
FROM otel_metrics
WHERE name = ‘agent.response_latency_ms’
AND timestamp >= now() – INTERVAL 24 HOUR
GROUP BY model, ts
ORDER BY ts ASC;
– Success rate by route (rolling 1h)
WITH
sumIf(value, name = ‘agent.success’) AS succ,
countIf(name = ‘agent.success’) AS total
SELECT
route,
toStartOfInterval(timestamp, INTERVAL 1 hour) AS ts,
if(total = 0, 0, succ / total) AS success_rate
FROM otel_metrics
WHERE timestamp >= now() – INTERVAL 24 HOUR
GROUP BY route, ts
ORDER BY ts;
– Tokens per minute by customer_tier
SELECT
customer_tier,
toStartOfMinute(timestamp) AS ts,
sumIf(value, name = ‘agent.output_tokens’) AS tokens
FROM otel_metrics
WHERE timestamp >= now() – INTERVAL 6 HOUR
GROUP BY customer_tier, ts
ORDER BY ts;
– Error logs (last 1h)
SELECT
timestamp,
severity_text,
body,
attributes:error AS err,
attributes:model AS model,
attributes:route AS route
FROM otel_logs
WHERE timestamp >= now() – INTERVAL 1 HOUR
AND (severity_number >= 17 OR JSONExtractBool(attributes, ‘error’) = 1)
ORDER BY timestamp DESC
LIMIT 200;
– Trace sample count by service
SELECT
service_name,
count() AS spans
FROM otel_traces
WHERE timestamp >= now() – INTERVAL 1 DAY
GROUP BY service_name
ORDER BY spans DESC;
10) Production notes
– Separate environments: run separate DBs or add service.environment in resource and filter in Grafana.
– Cardinality guardrails: cap dynamic attributes (e.g., customer_id) or hash/map to tiers. High-cardinality tags can blow up storage.
– Backpressure: tune batch processor send_batch_size and timeouts. Add queued_retry if you expect spikes.
– Ingestion SLOs: keep ClickHouse inserts under 50–100 MB per batch for stable performance on small VMs.
– Storage: start with 2–4 vCPU, 8–16 GB RAM, NVMe. Enable ZSTD compression and TTLs.
– Security: do not expose ClickHouse or Grafana admin to the internet. Use VPN, SSO, or OAuth proxy.
– Backups: S3-compatible backup via clickhouse-backup or object storage disks.
– Cost: This stack runs comfortably on a $20–40/month VPS for moderate load (tens of thousands of spans/min and metrics).
Extending the pipeline
– Add dbt for derived metrics (e.g., session-level aggregation).
– Add alerting in Grafana: p95 latency > threshold, success_rate < X, tokens/min anomaly.
– Add router-level tracing to attribute latency to providers and prompts.
This is a deployable baseline that turns your AI agent traffic into actionable, queryable telemetry with low operational overhead.